


How to Use F&O Stock Top 10 Gainers and Losers with the FNO Calculator: A Comprehensive Guide

February 2, 2025
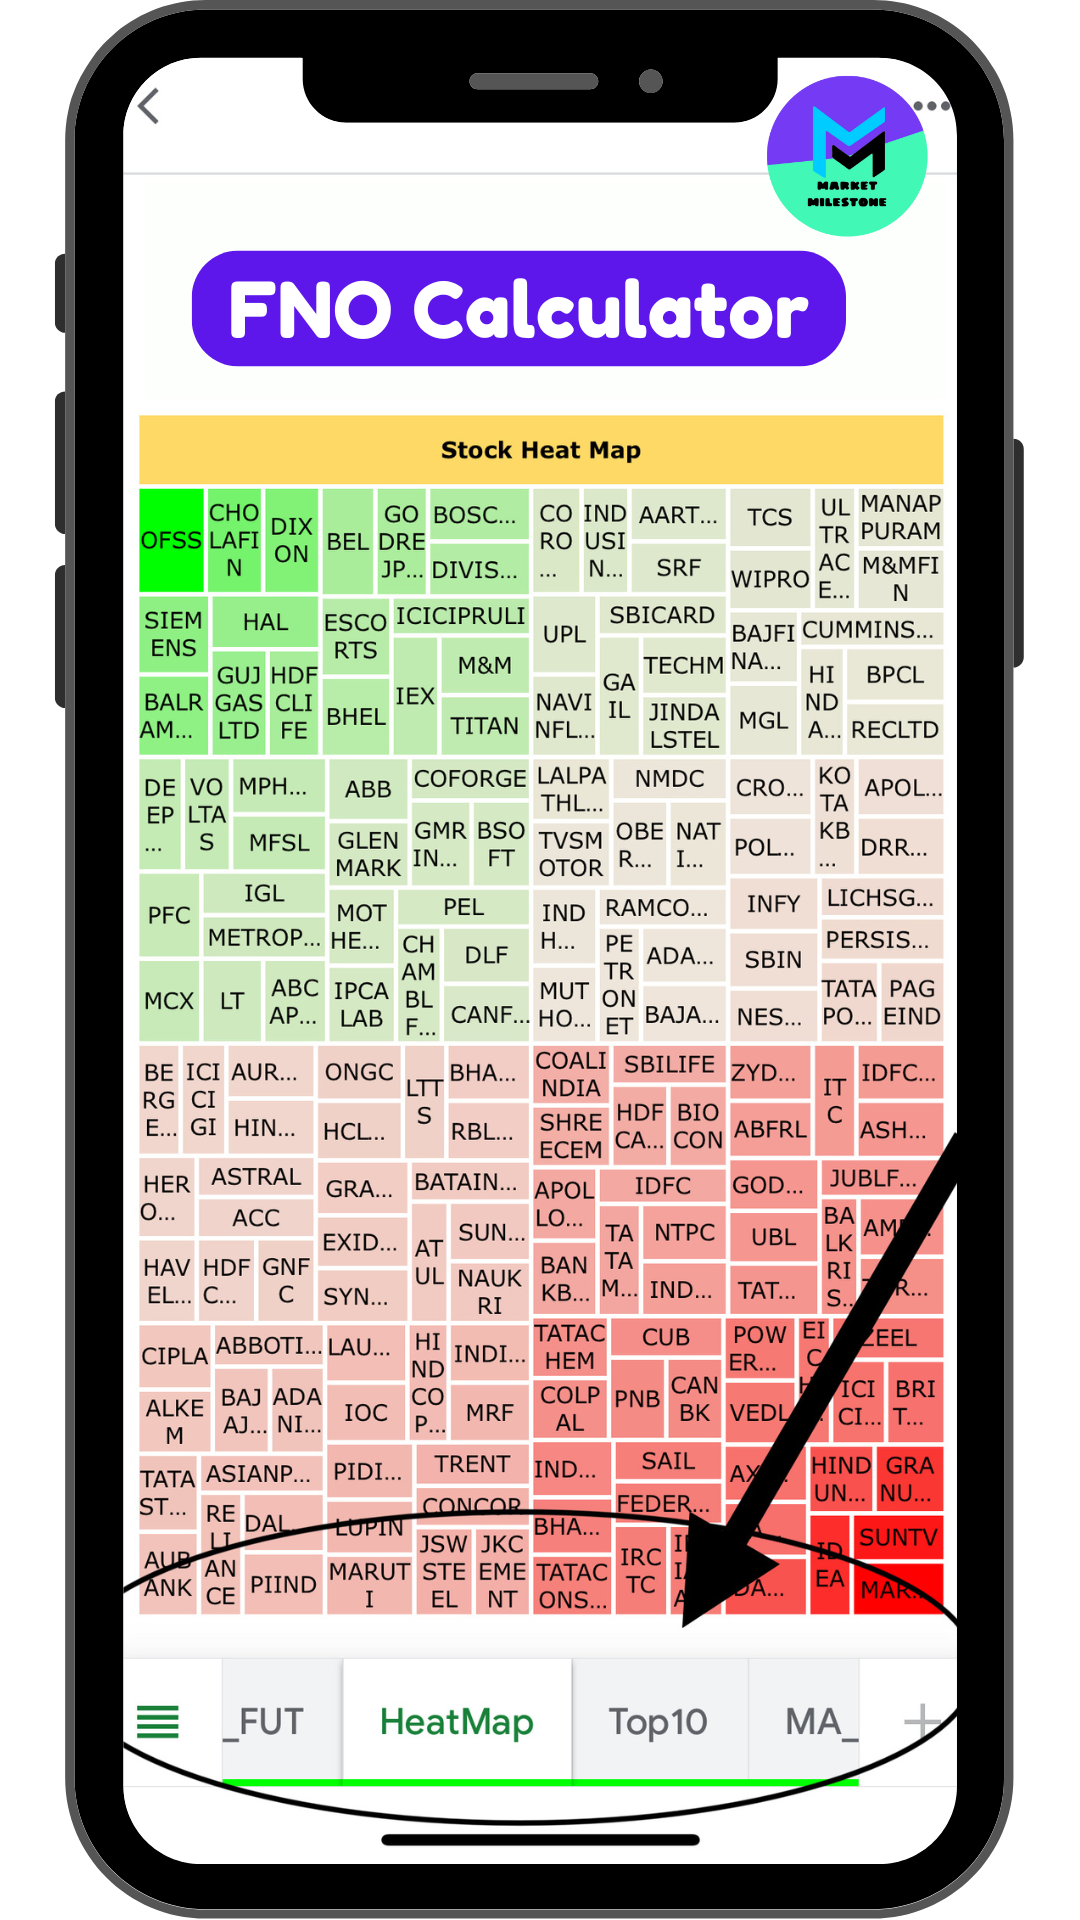
Introduction In the fast-paced world of stock trading, traders and investors rely on various tools to make informed...