Approach & assumptions
To produce price forecasts, we use a simple and transparent method: assume future share-price growth broadly tracks sustainable earnings (EPS) growth and that valuation multiples remain broadly stable. We set three CAGR scenarios to capture plausible outcomes for a mature FMCG leader like HUL:
- Conservative: 5% p.a. (slow growth environment, margin pressure)
- Base: 7% p.a. (steady mid-single digit growth reflecting pricing power + modest volume recovery)
- Optimistic: 9% p.a. (stronger rural recovery, premiumisation, margin improvement)
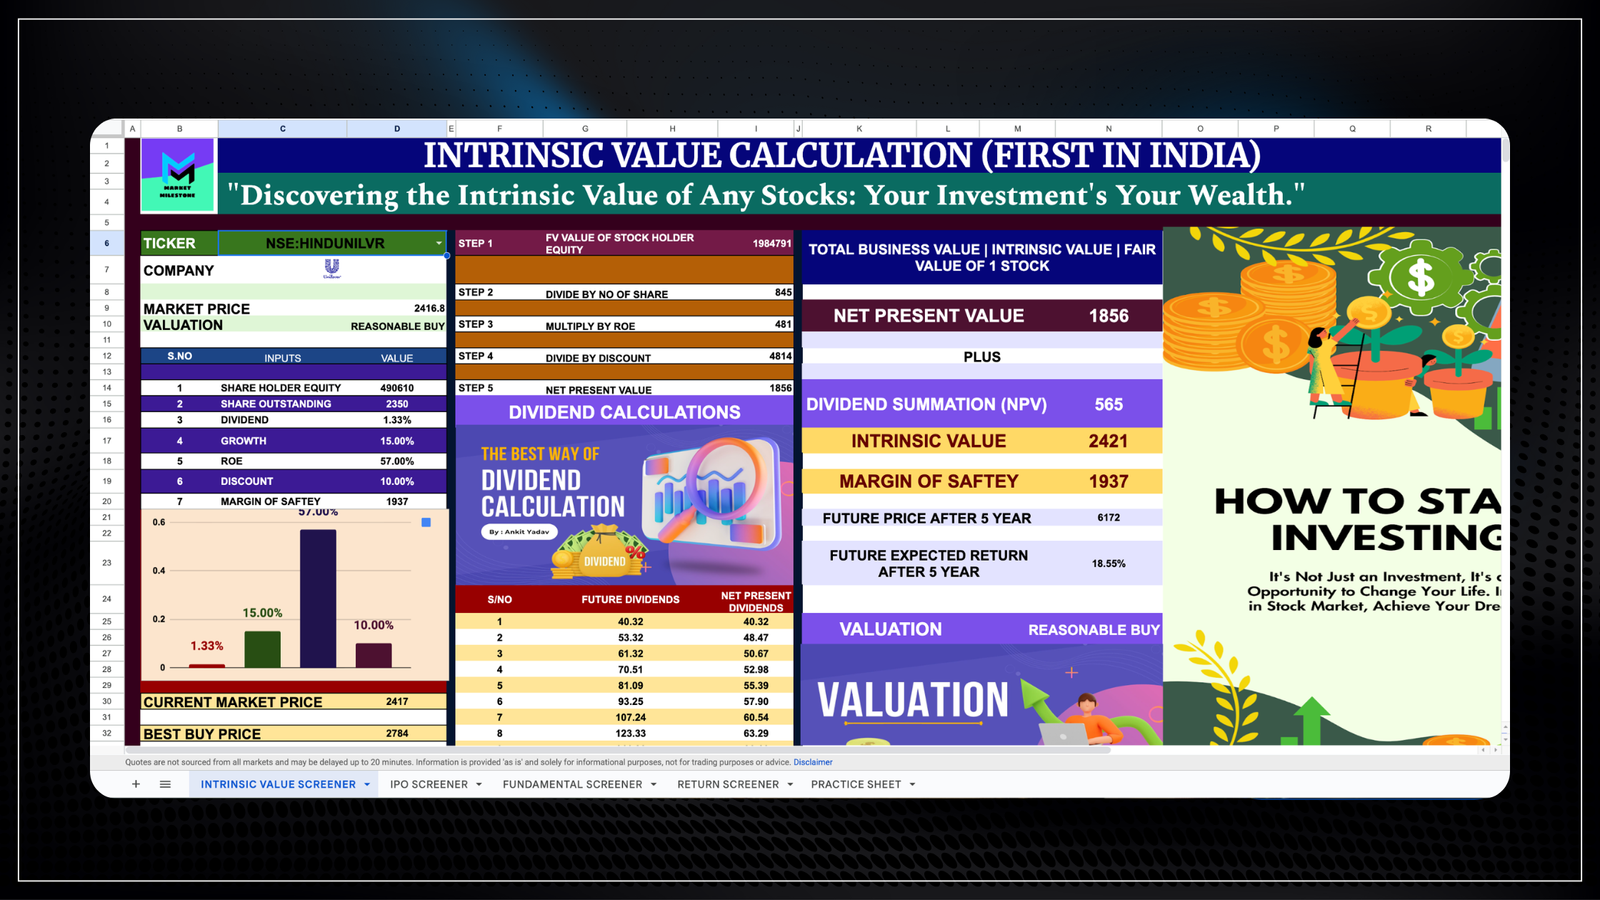
Start price (snapshot): ₹2,414 (Nov 2025).
Formula used: Future Price = Current Price × (1 + CAGR)^n
(n = years from 2025 to target year)
Forecasts (price per share — rounded)
Conservative (5% p.a.)
- End-2025: ₹2,414 (starting)
- End-2030 (5 years): ₹3,081
- End-2035 (10 years): ₹3,932
- End-2050 (25 years): ₹8,175
Base (7% p.a.) — our mid scenario
- End-2025: ₹2,414
- End-2030: ₹3,386
- End-2035: ₹4,749
- End-2050: ₹13,102
Optimistic (9% p.a.)
- End-2025: ₹2,414
- End-2030: ₹3,714
- End-2035: ₹5,715
- End-2050: ₹20,816
These projections show how modest differences in CAGR compound substantially over multi-decade horizons. The base case (7%) produces mid-thousands by 2035 and a large nominal number by 2050, reflecting long-term compounding on a blue-chip base.
Implied market capitalisation
Applying the same growth factors to the current market cap (~₹5.687 trillion) gives a sense of scale:
- Base 2030 cap ≈ ₹7.98 trillion; Base 2050 cap ≈ ₹30.87 trillion. (All rounded.)
Financial snapshot (recent trends)
HUL remains highly profitable with consistent margins and industry-leading returns. FY2024-25 consolidated revenue is about ₹64,100–64,243 crore, with annual net profit near ₹10,600 crore (consolidated/base-year figures), reflecting slow but resilient top-line growth and margin resilience amid commodity cost pressure.
Return on equity (ROE) has been very healthy — around 20–21% in recent annual reports — showing excellent capital efficiency for an FMCG leader. That high ROE supports the plausibility of sustaining mid-single-digit earnings growth while returning cash to shareholders.
Rationale behind the CAGR bands
- 5% (Conservative): persistent urban demand weakness, aggressive input-cost cycles (palm oil, packaging), and occasional distributor/retailer destocking (as seen with GST shifts) could keep volume and margin expansion muted.
- 7% (Base): modest volume recovery, sustained pricing power, rural revival and premiumization — realistic for a market leader with scale.
- 9% (Optimistic): faster portfolio upgrades, digital & D2C gains, cost efficiencies and favourable macro driving above-trend EPS growth.
Key risks
- Input-cost volatility: raw material swings (edible oils, paper/pulp, chemicals) can compress margins.
- Consumer demand shifts: prolonged income pressure or rapid competitor disruption could slow volumes.
- Valuation risk: our forecasts assume broadly stable multiples; if market multiples compress, price may lag EPS growth.
- Regulatory & tax shocks: changes in indirect taxes or regulatory constraints can temporarily disrupt demand or supply chains.
Conclusion
Hindustan Unilever is a low-risk, high-quality consumer franchise. Using defensible CAGR bands (5–9% p.a.) and a clear compounding framework produces a reasonable range of outcomes: by 2030 the stock could plausibly trade between ~₹3,080–₹3,714, and by 2035 between ~₹3,930–₹5,715, depending on execution and macro tailwinds. Over very long horizons (to 2050) small differences in CAGR create very large nominal gaps — underscoring the power of compounding for a stable, high-ROE business.